
New Delhi’s air pollution
The case of a huge metropolis in India
Corentin Raimbaud has investigated air pollution in New Delhi (India). This pollution has several causes, but for now he has focused on motorized transport. We are pleased that Raimbaud is willing to share his results with Favas.net.
Air pollution is the result of many different factors: transport and mobility, but also industrial emissions, fossil fuel combustion, wildfires, construction, agriculture activities, indoor air pollution. From those of them, the transport sector is the source of a global problem of environmental pollution and traffic congestion in cities. Multiple research studies have shown links between air quality and air pollution from transport. And today we know that it accounts for a large proportion of the world’s environmental and health problems, to which more and more countries are coming together to pool their efforts on the application of restrictive measures, to find solutions.
Greenhouse gas (GHG) emissions from transport sector represented 24% in 2018 with 8 billion. Nowadays, it is becoming a major global concern against global warming and public health consequences according various reports of the Intergovernmental Panel on Climate Change (IPCC). The car plays a major role in our travel, the way it has adapted and shaped our cities. At present, the trend is reversing and our cities are developing with regard to alternative means of individual and/or public transport in favour of the car. In fact, various actions are being taken to change people’s habits regarding mobility and its impacts due to emissions. And it must be emphasized here that these actions will affect all inhabitants of metropolises like our case New Delhi.

The case of New Delhi
Our air pollution case study in New Delhi will be linked specifically to the transport sector and focuses on numerical trends and policies to positively adjust or reverse these trends.
According to IQAir’s 2019 World Air Quality Report, twenty-one of the world’s thirty cities with the worst level of air pollution are in India. Six Indian cities are in the top ten. Air pollution is causing massive public health and environmental crises. An estimated one million deaths each year, and 980,000 preterm births, are attributed to air pollution from fossil fuel in India.
Of all the cities in India, the capital area, Delhi has the most serious air pollution. This pollution is the result of multiple factors (vehicle exhaust, heavy industries, dust, seasonal emissions from forest fires, harvest, etc.). The consequences are devastating, partly due to high particulate matter concentrations in the air (environment), reduction in life expectancy (health) and high costs incurred by the state to solve the crisis (economic). It goes without saying that as a result of all this, Delhi also suffers social damage.
Urbanization figures
New Delhi is the capital of India and is part of the 11 districts of Delhi. The city itself has 257,803 inhabitants. The Delhi metropolitan area is approximately 42.7 km2 along with a population of over 18 million. This huge metropolis is one of the fastest urban areas in the country. Due to the rapid urbanization, the landscape of Delhi has changed from a major rural to a dominantly urbanized territory. This is reflected in the population figures in the next table.
| Description | 2001 | 2011 | 2020 |
| Actual population | 13,850,507 | 16,787,941 | 18,710,900 |
| Population growth | 46.31% | 21.21% | 11,45% |
Population development of the National Capital Territory of Delhi
Vehicules use statistics
According to the Economic Survey of Delhi in their 2020-2021 report, the total number of motor vehicles on road in Delhi in 2020 was 11,892,000, showing a growth of 4.40% (see table below).
| Number of Vehicles | |||||
| Vehicle type | 2015-16 | 2016-17 | 2017-18 | 2018-19 | 2019-20 |
| Cars and jeeps | 2 986 579 | 31 52 710 | 3 246 637 | 3 249 670 | 3 311 579 |
| Motor cycles & scooters/ two wheelers | 6 104 070 | 6 607 879 | 7 078 428 | 7 556 002 | 7 959 753 |
| Rickshaws (passengers) | 198 137 | 105 399 | 113 074 | 113 240 | 114 891 |
| Taxies | 91 073 | 118 308 | 118 060 | 109 780 | 122 476 |
| Buses | 34 365 | 35 206 | 35 285 | 32 218 | 33 302 |
| Other passenger vehicles | 6 368 | 59 759 | 76 231 | 81 422 | 85 477 |
| Tractors | 281 159 | 300 437 | 315 080 | 246 861 | 263 112 |
| Goods vehicles | |||||
| Others | |||||
| Total | 9 704 741 | 10 382 757 | 10 986 015 | 11 391 551 | 11 892 877 |
Years wise growth of vehicle fleet
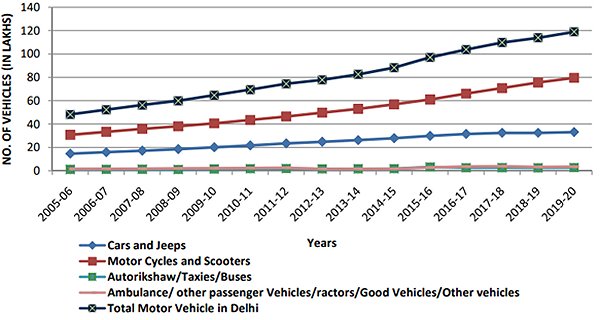
New Delhi increase of vehicles (1 Lakh=100 000 unities).
The annual increase vehicles in Delhi decreased from 8.13 % in 2005-06 to 4.40 % in 2019-20. During the same period the number of vehicles per thousand population increased considerably from 317 to 643.
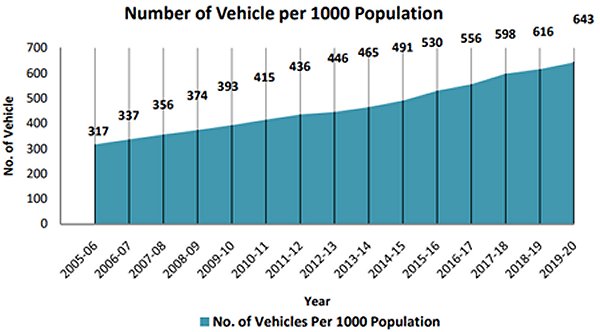
Number of vehicles per 1000 habitants
Air quality of Delhi
Despite rapid urbanization and increase of motorized vehicles the Air Quality Index of Delhi for the period 2016 to 2019 shows that all Good/Satisfactory/Moderate days have increased significantly and Poor/Very Poor/Severe days in total have gone down as compared to year 2018.
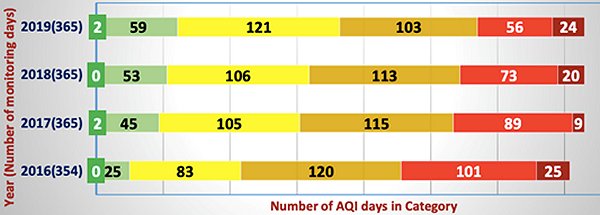
New Delhi Air Quality Index (2016-2019)
Still, India has been particularly vulnerable to air pollution over the last two decades, owing to population growth, increasing numbers of vehicles, use of fuels, inefficient transportation systems, poor land use patterns, industrialisation, and ineffective environmental regulations. New Delhi has the highest ambient particulate matter pollution exposure in the country. As of 2019, the Delhi’s average annual PM2.5 concentration was 98.6 micrograms per cubic meter.
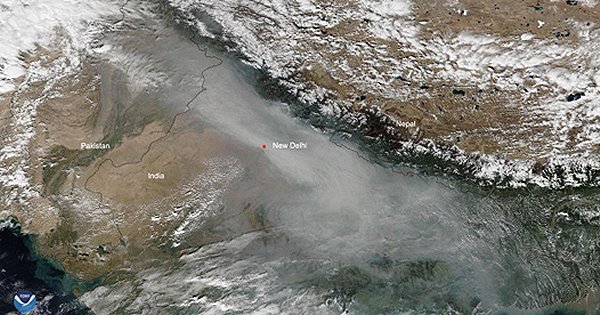
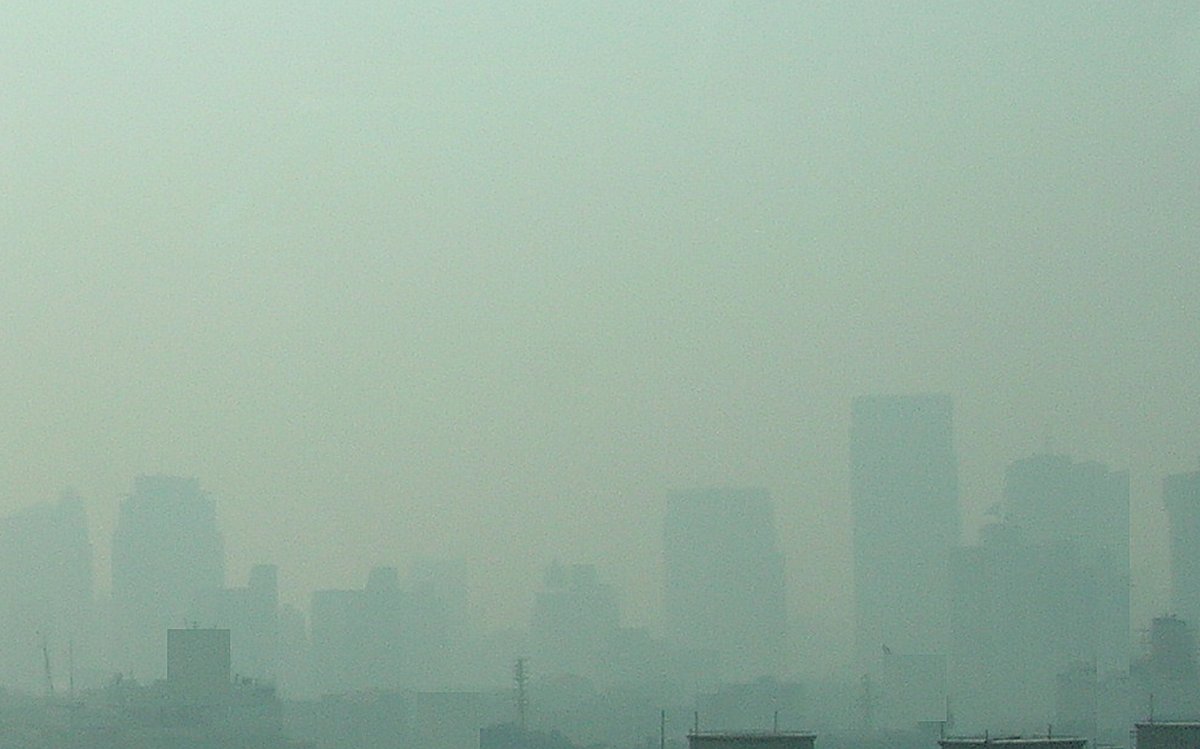
Satellite image of smog above New Delhi (Source: National Oceanic and Atmospheric Administration)
In Rahul Goel and Sarath K. Guttikunda’s study (2015) on the evolution of exhaust emissions from road vehicles a total estimation on-road from vehicle emissions in Delhi region is made for the period 1990-2030. Total emissions of particulate matter 2.5 peaked in the late 1990s, after which they decreased despite a steady increase in the number of vehicles on the road. Thus, they increased from 17,100 ton in 1991 to a peak of 25,300 ton in 1999, and then dropped to 12,700 ton in 2012. From 1999 to 2012, 90 % of the reduction in PM2.5 emissions came from buses, 4Ws and 2Ws with a share of 52 %, 24 % and 15 %. During the same period, PM2.5 emissions were halved for 4W and 2W vehicles while the number of these engines more than doubled from 0.8 million to 1.8 million and from 1.3 million to 3 million respectively. Their reduction in vehicles (4W and 2W) was more gradual, with much of the reduction in bus emissions occurring over a shorter period. This is due to the application of a series of emission standards on 4-wheel and 2-wheel vehicles. However, buses have undergone a more abrupt fleet change from diesel to CNG (compressed natural gas). In 2012, LDVs (light duty trucks) and HDVs (heavy duty trucks) had the highest share (67%), followed by 4Ws (20%) and 2Ws (8%). HDVs are mainly diesel vehicles, and LDVs are a mix of CNG and diesel. When classified by passenger mode (2W, 3W, 4W and buses) and freight mode (LDVs and HDVs), their share of PM2.5 emissions is 33 % and 67 %, respectively, which is highly disproportionate to their share in the vehicle fleet.
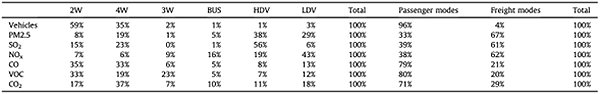
New Delhi share of emissions by passenger (2Ws, 3Ws, 4Ws and buses) and freight modes (LDVs and HDVs) for the year 2012.
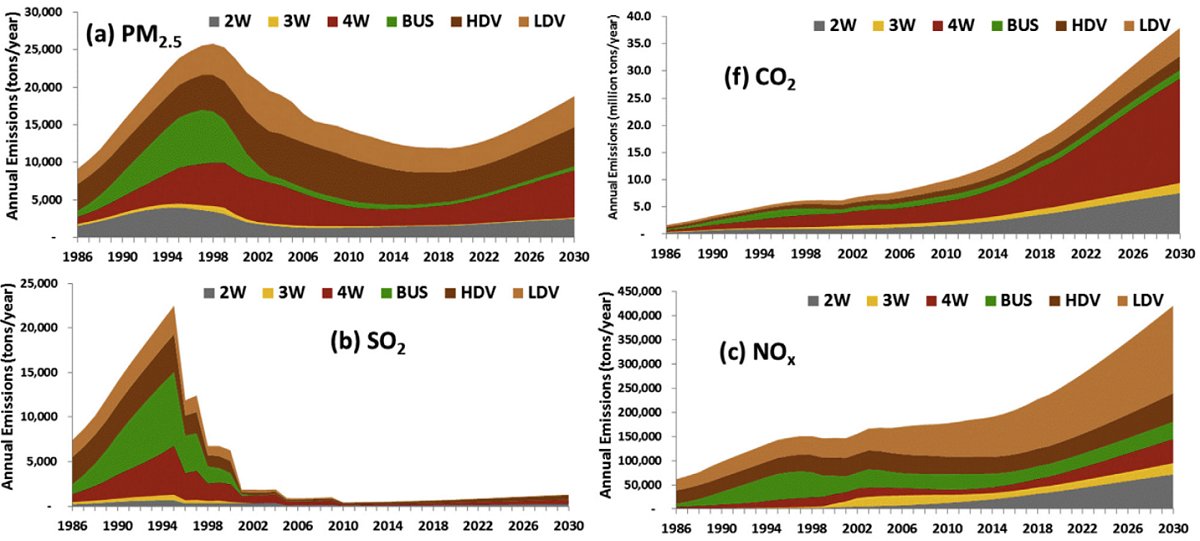
New Delhi (greater region) estimated annual on-road vehicle exhaust emissions in the Greater Delhi region between 1986 and 2030 (a) PM2.5 and (f) CO2.
CO2 emissions are related to the amount of fuel consumed. As the number of registered vehicles has increased, their total fuel consumption and CO2 emissions have also increased despite improvements in the equipment of individual vehicles. Total annual CO2 emissions from vehicles in use are estimated to be 3.8 million ton in 1991, 6.2 million in 2001 and 11.2 million in 2012, i.e. about three times higher.
Since the SO2 emissions are directly related to the amount of sulfur in the fuel, these emissions have reduced significantly, as a step function, as soon as the new fuel is available for use. The annual SO2 emissions increased linearly up to 1995 peaking at 22,500 ton and then reduced to 6500 ton in 1998, 4000 ton in 2001, 1100 ton in 2005, and 620 ton in 2012.
Overall NOx emissions have been increasing steadily, while PM, SO2 emissions have not. In 1991, the total amount of NOx emitted by vehicles on the road was estimated at 76,000 ton, in 2001 at 120,500 ton and in 2012 at 184,000 ton. From 1991 to 2012, 92% of the increase in NOx emissions is attributable to HDVs and LDVs (60%), 3Ws (17%), and 2Ws (14%). In 2003, NOx emissions from cars peaked at 13 200 ton and fell to 10,400 ton in 2012. The most dramatic increase in NOx emissions occurred in 3Ws from 3,000 ton in 1998 to 15,000 ton in 2012. This is due to the conversion of fuel and technology in light commercial vehicles from petrol and diesel with 2S engines to CNG with 4S engines.
Vehicle policy measures
The city of Delhi is developing new initiatives through an incentive policy to encourage the replacement of old vehicles by electric vehicles. Approved in 2020, the Delhi Electric Vehicle Policy has a primary objective of improving air quality by reducing emissions from the transport sector. The policy aims to adopt electric batteries in 25% of new registered fleets by 2024. The city also wants to put in place measures for financing, maintenance and charging of vehicles. Finally, a massive communication plan is envisaged to raise awareness of the benefits of electric vehicles and the key elements of the policy.
A number of transport infrastructure projects at Ring Road and Outer Ring Road were made to encourage use of public transport in Delhi. The Government of National Capital Territory (GNCTD) has decided to engage pure electric buses in Delhi which will go a long way to reduce overall vehicular emissions in Delhi with deployment of 300 electric buses.
To combat air pollution, multiple policies have been introduced in Delhi especially between 1998 to 2001. The table below gives the type of policies and the date of their implementation.
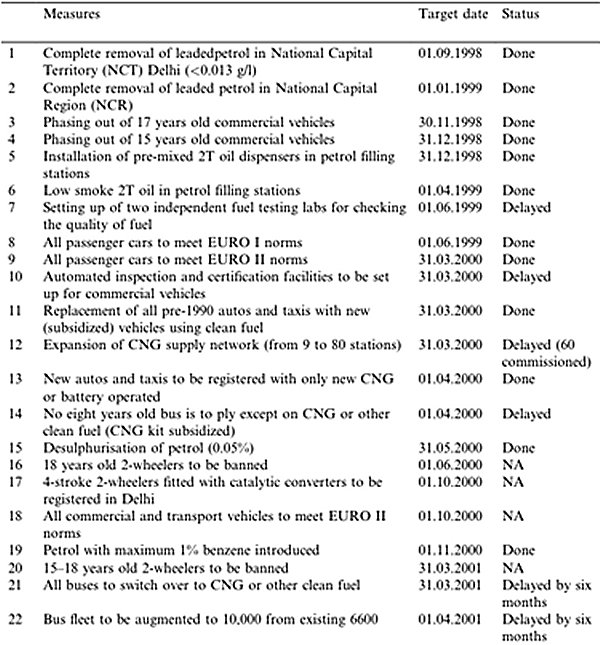
Policy instruments enacted to check vehicular pollution in Delhi (Sources: Central Pollution Control Board (1999) and author’s compilation on the vehicular pollution control)
Some of these measures are not specific to Delhi, as they were being implemented all-over India. Unfortunately, some of them have failed since their appearance.
Conclusion
Delh has serious pollution problems. The population of Delhi is going to increase further which will require more infrastructure and transport facilities. Although sulphur dioxide levels have decreased over time through the introduction of CNG buses, this effect has been counterbalanced by the influx of vehicles. Reversing the trend between private and public vehicles would have a positive impact on the reduction of particulate and gas emissions. The results would be much more apparent on air quality. The government needs to find new ways to make its policies benefit the economy as well as the environment – by strict rules, which nevertheless continue to promote entrepreneurship and initiatives of the population. In any case, New Delhi’s administration and politics as well as the citizens must make a concerted effort.
A note on social effects of air pollution in New Delhi
Media recently reported on the increase in the number of victims of air pollution. “Doctors with at least three city hospitals said they have been getting more patients with exacerbation of respiratory conditions such as asthma, respiratory infections, heart attacks and stroke”, according the Hindustan Times (November 10, 2021). Favas.net has not been able to trace any systematic research into the social effects of these consequences of air pollution. We have strong indications that there is no systematic monitoring here in New Delhi (and all of India for that matter). For the time being, based on local impressions, we draw the conclusion that air pollution has a bad social impact on the less well-off and the very poor population. Our strong impression: the disadvantaged population groups work more outdoors, do not have the means to protect their homes against air pollution (or they are living on the streets), the house is heated with wood, which releases a lot of soot and air filters are far too expensive for them. Moreover, the poorer inhabitants simply have less or no knowledge about the dangers of air pollution. In addition, they are longer on the way to work or school, hence, longer in the polluted air. The effects of mobility mapped here by Corentin Raimbaud particularly affect them.
References
“Annual report 2019-20,” Center Pollution Control Board, 2020.
Bhandarkar, “Their Effect on Human Heatlh and Mitigation Measure,” Vehicle System Dynamics, 2013.
Chahal, “The Effects of Vehicular Air Pollution on the Health, Economy and the Environment of New Delhi, India,” 2010.
“Delhi pollution: Vehicles, not stubble burning, main cause, says Teri study,” India Today, 2018. [Online]. Available: 2018.
“Economic Survey of Delhi 2020-21,” Government of NCT of Delhi, 2020-2021.
Goel and S. K. Guttikunda, “Evolution of on-road vehicle exhaust emissions in Delhi,” Atmospheric Environment, 2015.
IQAir 2019 “World Air Quality Report”, 2020 (Report V8).
“India: Dehli,” City Population, 2020. [Online]. Available: https://www.citypopulation.de/en/india/cities/delhi/
Kathuria, “Vehicular pollution control in Delhi,” Science Direct, 2002.
Narain and A. Krupnick, “The Impact of Delhi’s CNG Program on Air Quality,” Resources for the Future, 2007.
“New Delhi Population 2021,” World Population Review, 2021. [Online]. Available: https://worldpopulationreview.com/world-cities/new-delhi-population
“Thebig news: Kejriwal, Centre trade blame as Delhi pollution thickens, and nine other top stories,” Scroll.in, 2019. [Online]. Available: https://scroll.in/latest/942493/the-big-news-kejriwal-centre-trade-blame-as-delhi-pollution-thickens-and-nine-other-top-stories
Glossary
2W: 2 Wheels
4W: 4 Wheels
CNG: Compressed natural gas
CO: Carbon monoxide
CO2: Carbon dioxide
GHG: Greenhouse gasGNCTD : Government of National Capital Territory
NOx: Nitrogen oxide
PM: Particle emissions (e.g. PM2.5, particle seize 2.5 µm)
SO2: Sulphur dioxide
Acknowledgements
Project: Corentin Raimbaud
Editing: Favas.net (Rob van der Bijl)
Image of smog: Favas.net
Image of old man (at Yamuna Ghat, New Delhi): Ankit Sharma
Data and material used in this project by Corentin Raimbaud are obtained by means of desk research.
The project and underlying research by Corentin Raimbaud is based on the Course ‘Mobility & Space’, supervised by professor Rob van der Bijl, Ghent University (Belgium), 2021-2022.