City Maps – Rio de Janeiro
Maps mark the urban and social shape of cities (part 3)
In 1875, Rio de Janeiro (Brazil) is on the eve of major developments. The map shows the plan for the city at that time, but also offers unexpected perspectives on Rio as we know it today. Mapping the urban and social shape.
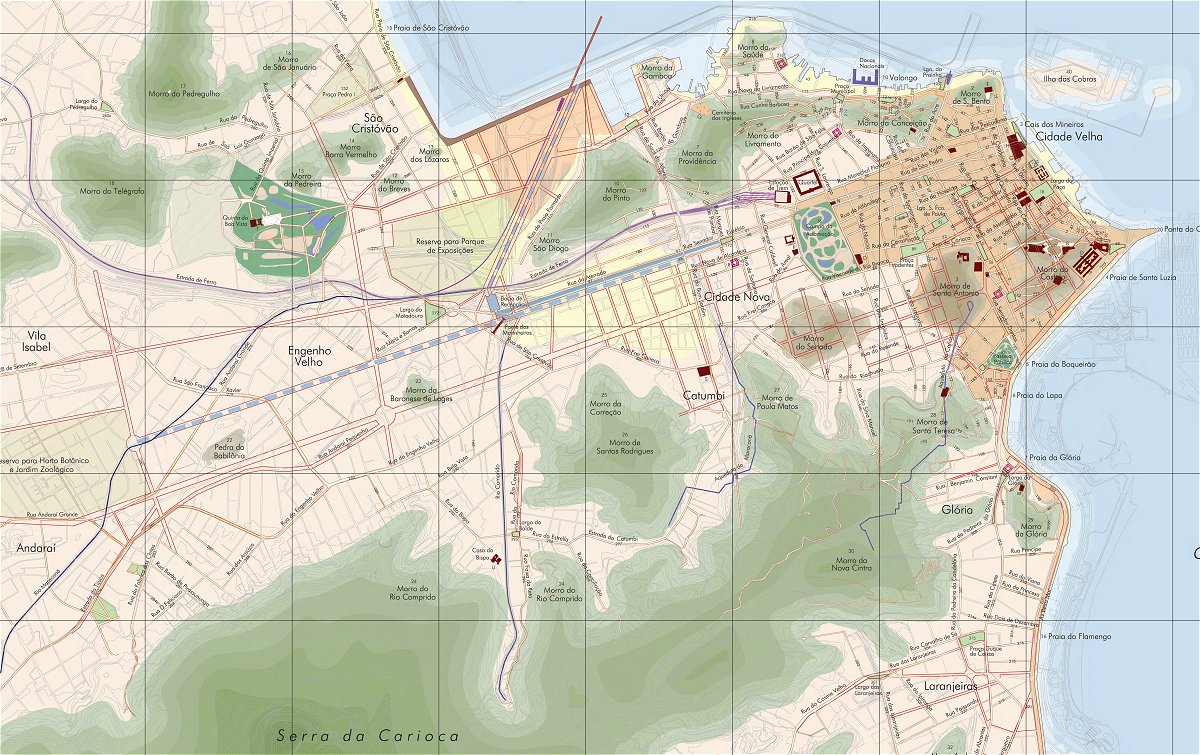
The map fragment covers an area of approximately 8 by 6 kilometres, almost as large as the area on the map itself. The city centre of Rio de Janeiro is located, not far from the ocean, on the narrow part of the Baía de Guanabara. The bay widens immediately north of the city centre. To the north (outside the range of the map) the bay extends far inland, which at that time still had a rural character (heavily urbanized in the twentieth century with districts such as Favela Penha). To the south, Rio is bordered by the mountain range of the Serra da Carioca.
The legend visualises the cadastral situation in the year 1875 and also shows the plans of the Comissão Melhoramentos (Improvement Commission). Striking is the dark brown reserved for the Cidade Velha (Old Town). The urban area around it is indicated in light brown. In the then extreme west of the city, the legend provides light yellow for the part of the city that was built between 1843 and 1875. The first railway is shown on the map (as a light purple line), as well as aqueducts (with a dark purple line). Furthermore, the legend includes indications for important buildings, facilities and parts of the port.
The Melhoramentos plan is summarized in five legend units, namely for tracing new streets and roads, for the route of a new canal, for the location of new port facilities, for land reclamation in the bay, and for new parks and open spaces.
History
Mapping the urban and social shape. At the beginning of the nineteenth century, Rio de Janeiro was little more than the current city centre. In 1875, the Old Town still housed all the important facilities. Outside of that, urbanization was mainly limited to the coastal region, with neighbourhoods such as Laranjeiras and Botafogo (just outside the bottom of the map fragment) a few kilometres south of the Old Town.
There was not much space between the mountainous hinterland and the coast. Even in the relatively flat terrain right on the coast, the many hills prevented urban growth. Morro de Santo Antonio in the Old Town is a clear example of this. Further on there were more of these hills, such as the Morro do Senado. Santo Antonio and Senado are indicated on the map as dark brown spots. The hills along the coast are green, as are the mountains in the hinterland.
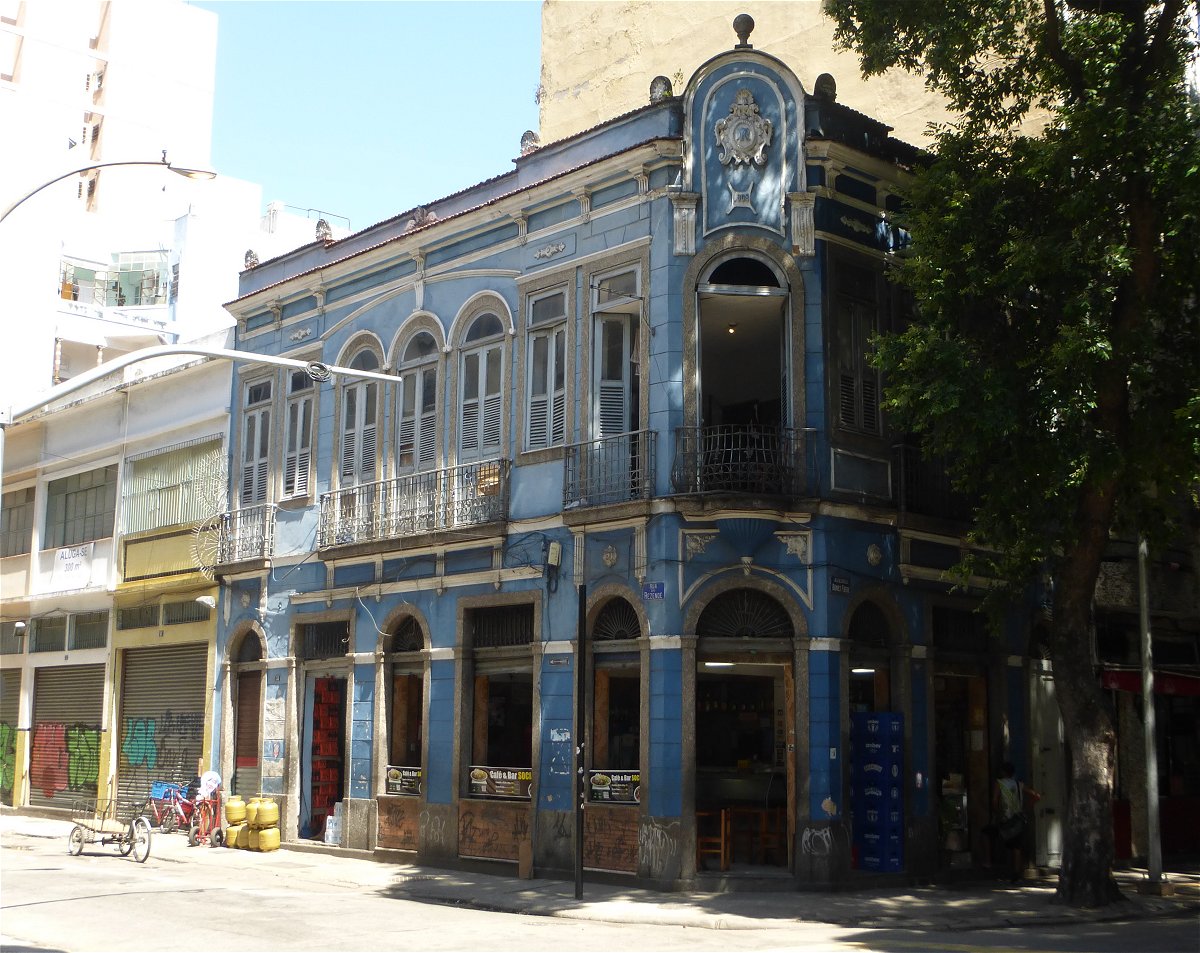
Rua do Rezende
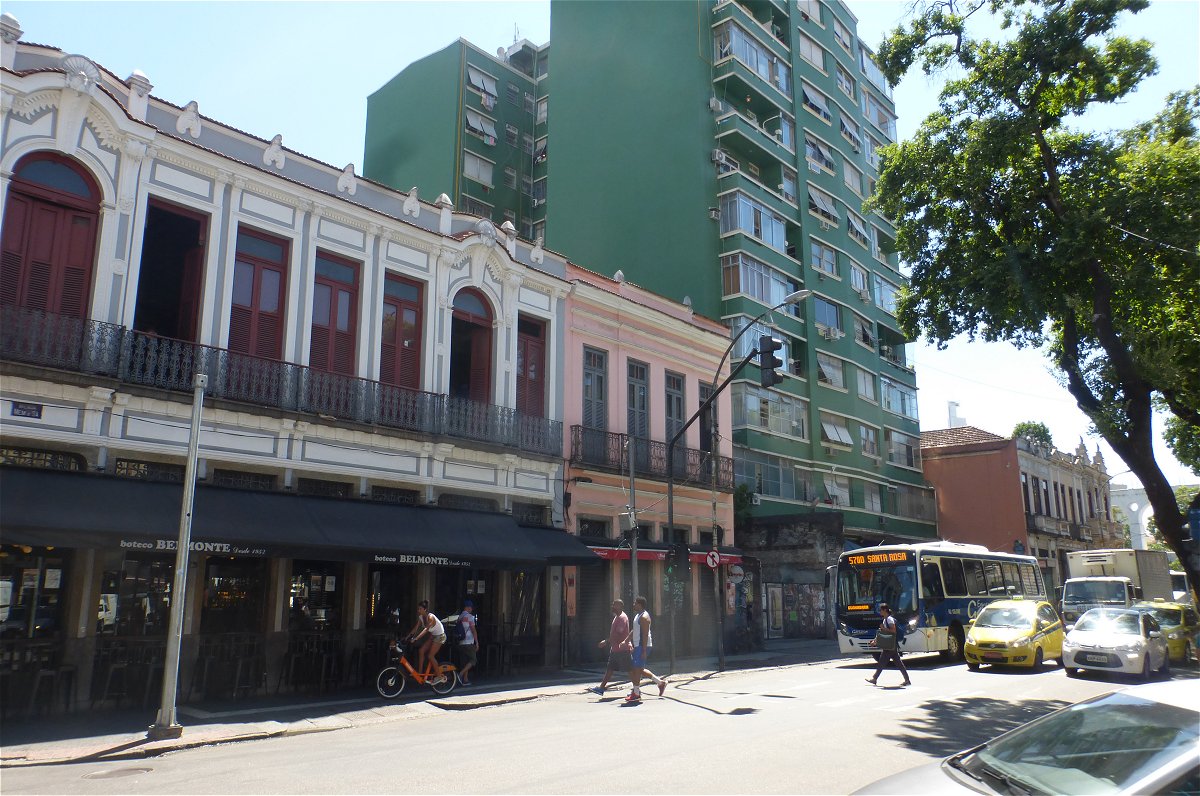
Avenida Mem de Sá
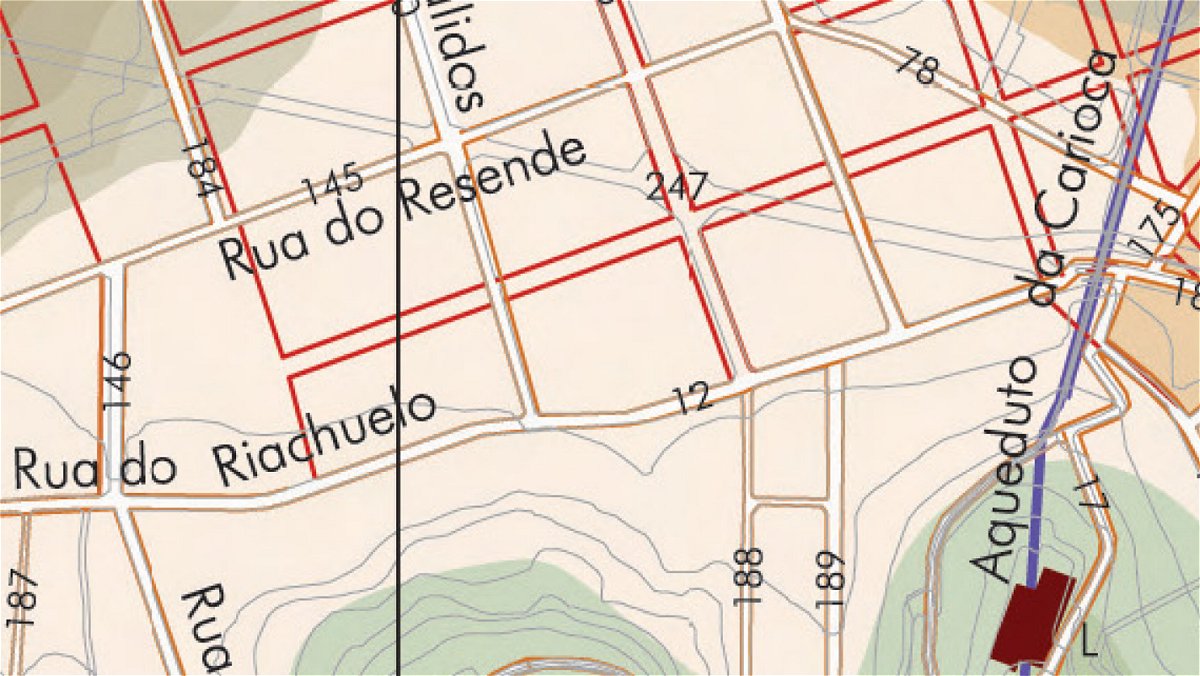
The Rua do Rezende is clearly marked on the map as a project of the New Town. Only the contours of the Avenida Mem de Sá have been drawn so far.
The map shows Rio on the eve of stormy urban developments and social stratifications. Like many other cities in the world, Rio is preparing for modern, technocratic oriented urban planning. The Plano da Comissão de Melhoramentos marks this change. The commission has clearly taken note of the urban planning in European cities such as Paris and Vienna. Despite the differences in height and the presence of two large hills, a grid-shaped street plan is designed. This grid was never fully realized, but the hills Santo Antonio and Senado would still be largely dug away over the years.
From the centre, parallel to the railway line, a new avenue and a new canal have also been drawn in towards the west. This infrastructure has largely been realised. For example, today Avenida Presidente Vargas runs between the Old Town and Praça da Bandeira, which provides access to a neighbourhood on reclaimed land in the north. Though not precisely according to the proposals of the Melhoramentos Commission, in stead the avenue that opened in 1944 was the result of a ruthless breakthrough accompanied by large-scale demolition of the historic Old Town.
Mapping the urban and social shape
This project clearly marked the beginning of the twentieth century that Rio would really change physically and socially. Not only did the city grow far beyond the Commission’s expectations, its structure also changed. With the opening of the first tunnel through the mountains between Botafogo and the new Copacabana district, the centre of gravity of the centre shifted towards the south.
The land reclamations proposed by the Commission are a prelude to this transformation of Rio. This is beautifully made clear on this map because the current coastline is also marked. In this way, it is possible to see the Rio of today through the eyelashes of the historical image of 1875. The current infrastructure is also drawn in within the new land behind the artificial coastline, which makes the map image even stronger. Rio’s airport turns out to be located in the sea right next to the Old Town.
However, this map is primarily a historical map. This is evident from the wealth of details. For example, the aqueducts, such as Maracană and Carioca. This brings the Rio of 1875 to life. The reader understands how the city’s important water supply worked. And can also orient oneself better, because the famous ancient Santa Teresa tram still runs over the Carioca viaduct, which was built in 1877, a year after the Comissão de Melhoramentos had presented its plan.
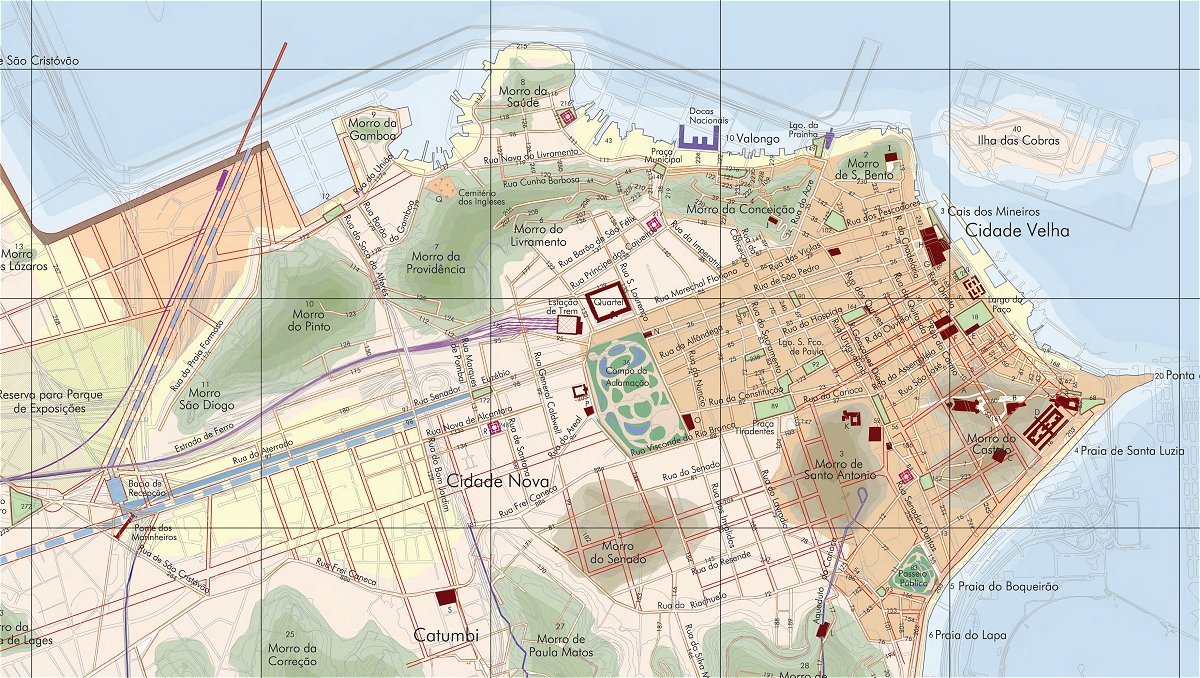
The Old Town (Cidade Velha) and the New Town (Cidade Nova).
Other episodes:
LA (California, US) & The Hague (Netherlands)
Fenglin (Taiwan)
Upcoming episodes:
Warsaw (Poland)
Belfast (Northern Ireland)
Parijs (France)
More on Rio de Janeiro at Favas.net:
The Penha case https://favas.net/projects/the-penha-case-2/
Favela Penha suffers police violence https://favas.net/news/favela-penha-suffers-police-violence/
The cable car of Alemão https://favas.net/news/the-cable-car-of-alemao/
Latin Impact – Latin Songs https://favas.net/news/latin-impact-latin-songs/
Acknowledgements
Text:
Favas.net (Rob van der Bijl).
Map image:
Atlas Andreatta. Atlas dos planos urbanísticos do Rio de Janeiro de Beaurepaire-Rohan ao Plano Estratégico (Vivercidades, OAS, 2008), compiled by Verena Andreatta.
Images Rua do Rezende & Avenida Mem de Sá:
Roel Schoemaker, February 9, 2019.
This episode was created in collaboration with Juliette van der Meijden.
See also: https://undiaunaarquitecta.wordpress.com/2015/10/14/verena-vicentini-andreatta-1957/
The series ‘Maps mark the urban and social shape of cities’ is based on the former series Plattegrond, in Blauwe Kamer, a Dutch magazine for landscape architecture and urban planning (the series was published 2003-2020).

